Hi @jbob,
The whole “Content Paint” bit refers to how long it takes to fully show your page on a screen from the moment the page starts to load.
A number of things influence that speed. For starters, the infrastructure. How long does it take the server that hosts your site to start offering content to the visitor, does it allow multiple files to be downloaded at once and how fast does it offer those files.
Nothing you can do to improve that, other than switching hosts or plans.
Another factor is file sizes. If your site offers up large images (for example), that constantly shift your page layout as they load and cause the page to load slowly, then this factors negatively into your score.
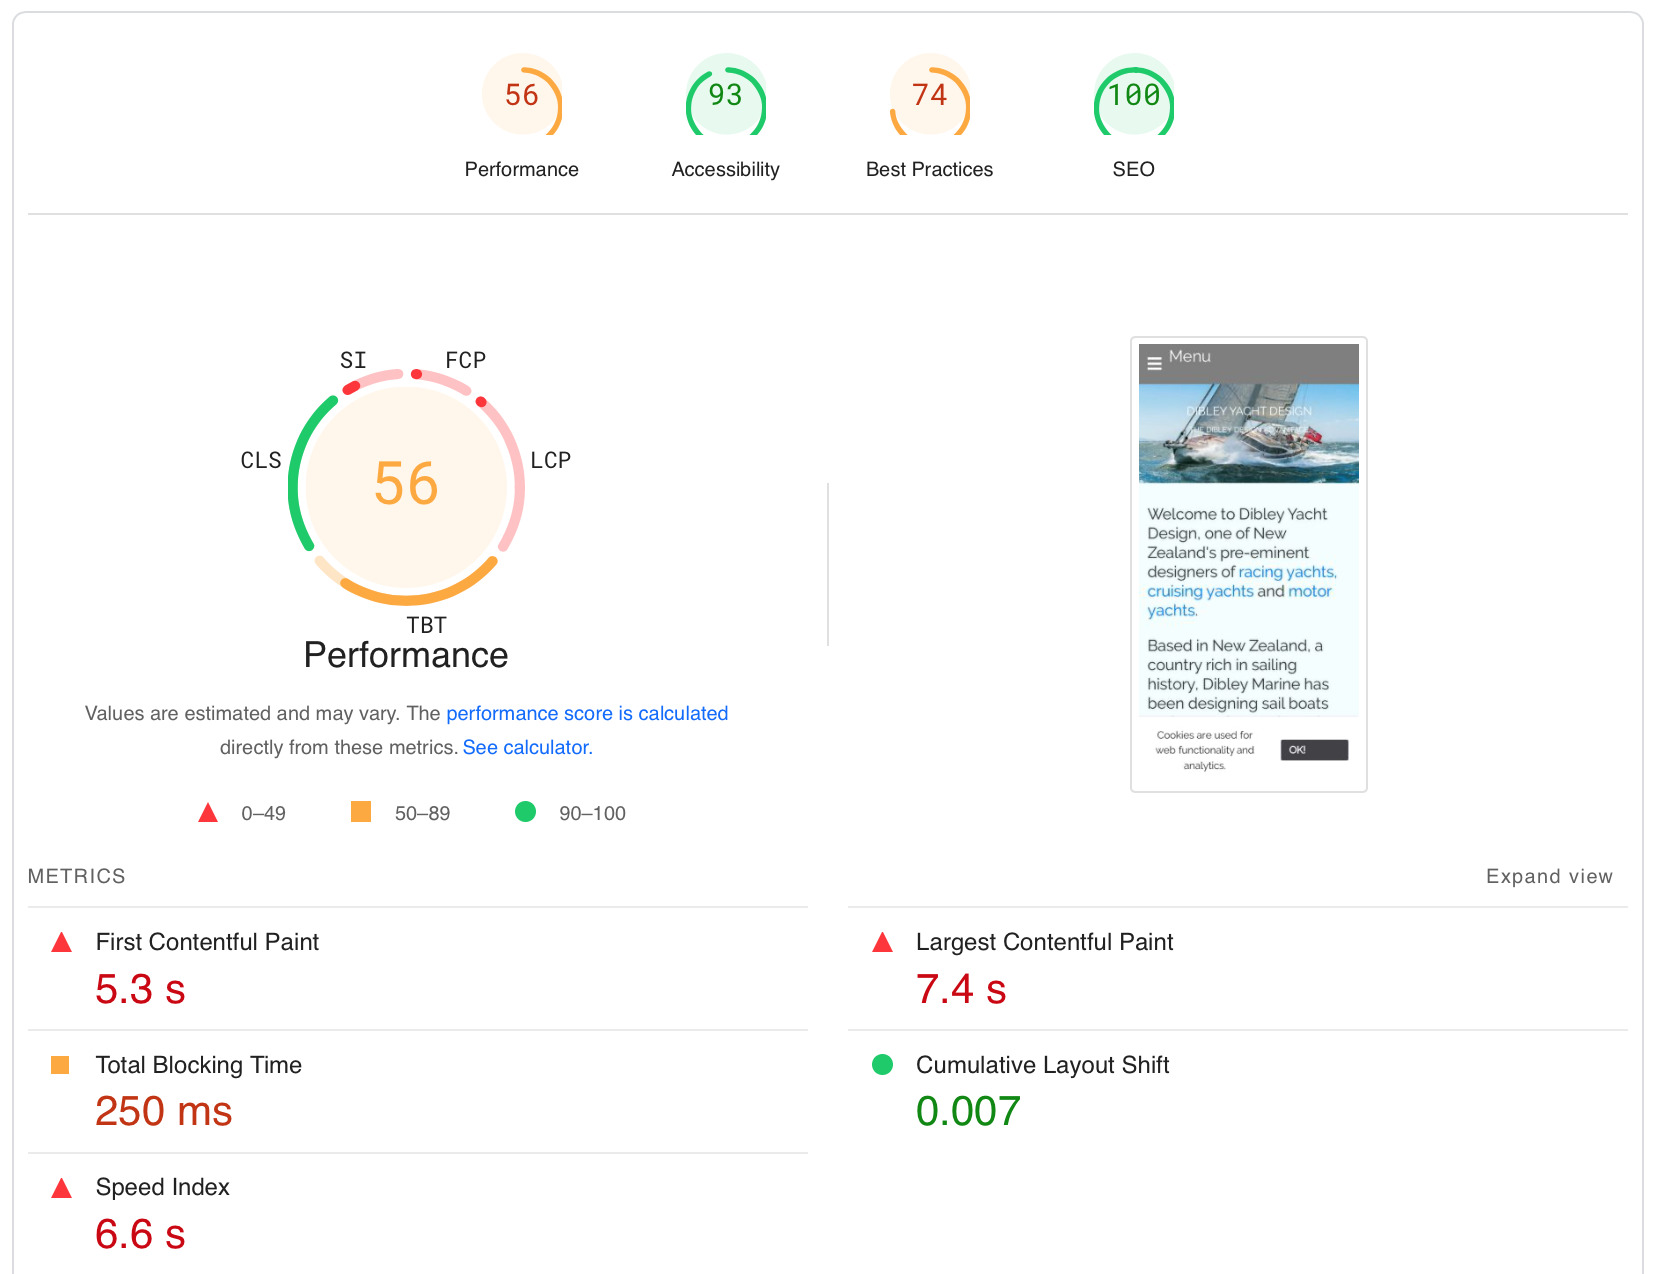
First Contentful Paint measures how long it takes until the visitor sees something happening on their screen - text loading, images loading etc. It’s generally considered the first sign of life from a page, reassuring the visitor that the page indeed does still exist.
Largest Contentful Paint measures how long it takes for your site to become actually useful to your user, by displaying to what it considers the most important bit on your page. This can be a large body of text, or a dominant image for example.
Google expects you to prop up these scores by optimising your page layout. If your most important bit of the site is the text, then they expect you to make sure that this loads first. If it’s an image, they expect you to make sure that loads first and so on.
This is a bit difficult to do in Stacks, as you have no control over what loads first. I’ve tried to manipulate this by having larger images loading in so called lazy loading image stacks, which causes the page to only start loading those images as they scroll into view (and not before that). This causes the server to prioritise the other elements, like the dominant text.
If the dominant element is an image, then make sure the image loads fast. I.e. limit the resolution (and thus the file size) or make sure the image loads from a fast server. If the image comes back multiple times on your site, then warehouse it so the browser can cache it.
Time to interactive and total blocking time both measure the time that passes until the user can actually do something on your page (scroll, search, click a link etc.). If you have large interactive elements like scripts running in PHP or JS, then they can cause this score to be low. This includes elements loaded externally from third parties.
Now, looking at your scores, the CLS is great so the layout of your page doesn’t shift as it loads. So no worries there. FCP and LCP are red though, and heavily impact your page’s score. This means that some elements on your page load slow. You could check your images and see if you can reduce the file size a bit. This helps heaps.
TBT is also red - you can measure why this is quite easily.
- Install Chrome
- Make sure your browser cache is empty
- Press F12 (or fn+F12 if just F12 adjusts your Mac’s volume) to open the dev Console
- Click on the Performance tab
- Click the Record button
- In the main browser window, navigate to your website and click around a bit.
- Go back to the Dev Console and stop the recording
You’ll now get an overview of what was loaded and how it impacted LCP, FCP, TBT and all the rest. You should now be able to figure out which file(s) impact your score(s) negatively and take the appropriate actions (like reducing the file’s size).
Cheers,
Erwin